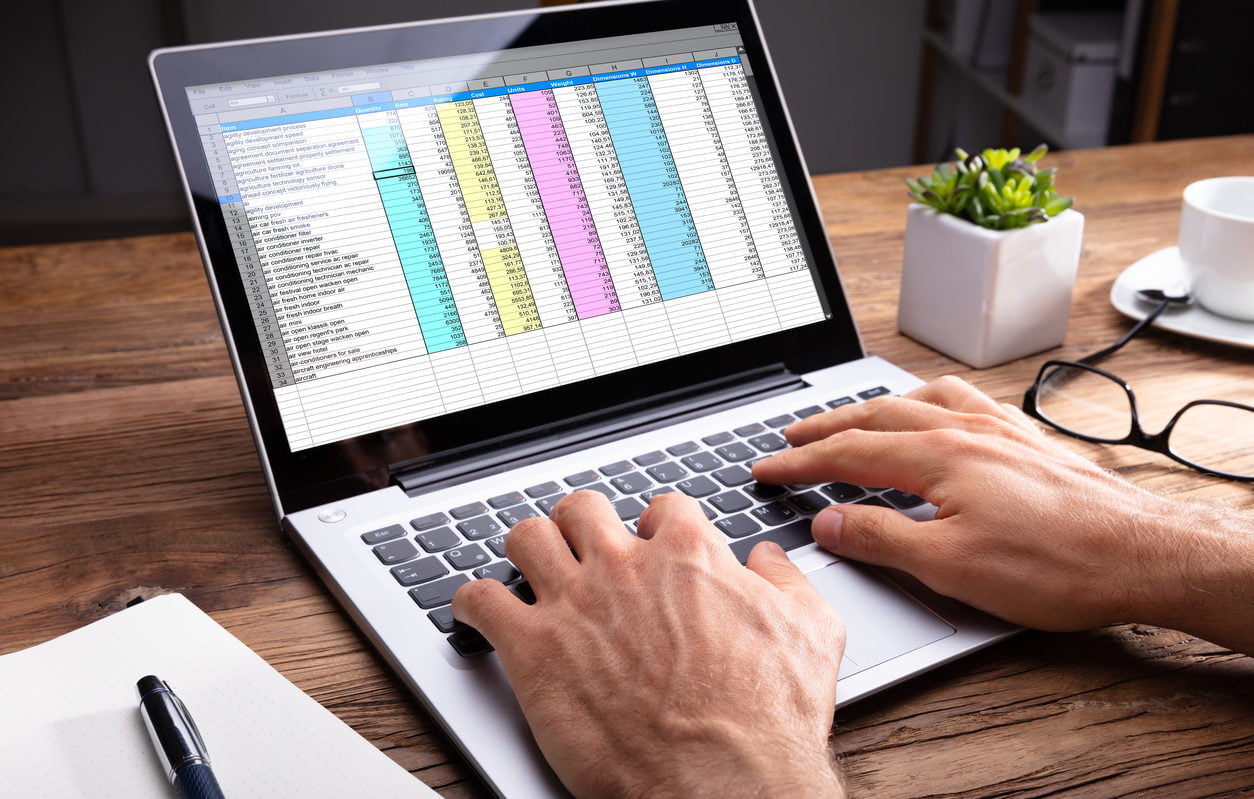
Students may benefit much from using Excel. Excel may be used by students to teach them how to transform unstructured data into knowledge. Excel activities will teach them how to complete calculations more quickly. Excel will help them comprehend how data may be visualized. They will pick up financial planning skills. Students may discover why filters need data and information.

They will learn in Excel why tracking goal progressions, salaries, and other essential topics are things they will encounter and use in the future. However, if they practice these topics using Microsoft Excel earlier in their careers, it will be simple for them to handle large amounts of data and information in the future with ease and accuracy.
Excel allows pupils to quickly and accurately calculate
Students may do difficult mathematical, logical, and financial calculations more quickly and accurately by using Microsoft Excel formulae, formatting choices, and other data management and visualization capabilities.
Numerous tools and functions for both education and business are included in Microsoft Excel. It implies that students will find it simpler to manage and comprehend the pattern of data and information whether they enter a computer or computer science degree program or any firm if they begin learning about and using Excel as soon as feasible.
Using Microsoft Excel helps develop sharp analytical abilities
The Microsoft Excel application examines pupils' creative productivity. Economic and financial matters are crucial to our way of life. Later, they will have to handle their own finances as well as those of their own businesses, HR departments, and workplaces.
Due to poor finances or money management, many company owners and individuals have commercial difficulties. These skills will be taught to students in Excel so they may succeed in business and in their careers, or at least rise beyond it. Excel may aid in developing sound financial reasoning by maintaining and carrying out financial computations for both company and personal life.
Students may learn how to conduct the computation
Data and information are presented to us all through blogs, TV, newspapers, and books using images like charts, graphs, diagrams, and reports. For instance, we may determine how products and services were generated in the years 2016–2017 by looking at the Indian Gross Domestic Product and its outcomes.
Students may discover how to visualize data
As an example, students are watching a television game of cricket. They may watch a batsman's vegan wheel, showing that he or she made 145 runs in 112 balls, including 83 runs offside and 62 runs onside. Now we can teach our pupils how to use Microsoft Excel to accomplish the same computation and to display the same graphs, diagrams, or vegan wheels.
Another illustration might be a bar chart that highlights the runs scored in each over. Large bars indicate more runs scored, whereas narrow bars indicate low-scoring overs. Now that they can, students may practice using Excel to visualize the data they are seeing.
Excel contains more. Utilize this Excel Spreadsheet Expert training to improve your skills. To learn more, go to the page.
